
Average position improves while qualified search visits decline. A ranking report should make that mismatch easier to investigate, rather than hiding it behind a green arrow.
Use this template to connect a stable keyword set with observed search features, AI answer coverage, and page-level actions. It keeps measurements separate when they use different denominators.
Download the keyword visibility report CSV. The sample rows are illustrative. Replace them with your actual query cohorts and observations.
Put the scope at the top
Name the property, reporting dates, comparison dates, query cohort, country, device, and data source. Record whether the set changed. A report cannot explain a trend reliably if nobody knows what stayed constant.
Separate branded queries from unbranded discovery and evaluation questions. Group queries by intent or topic so the report points toward a page decision. Keep new exploratory queries outside the established trend until the baseline is deliberately revised.
Give each metric a defined row
Include organic position or top-ten coverage, relevant SERP feature presence, AI Overview trigger and citation observations, assistant appearances, and owned-page citations. Add first-party traffic or conversion measures where available.
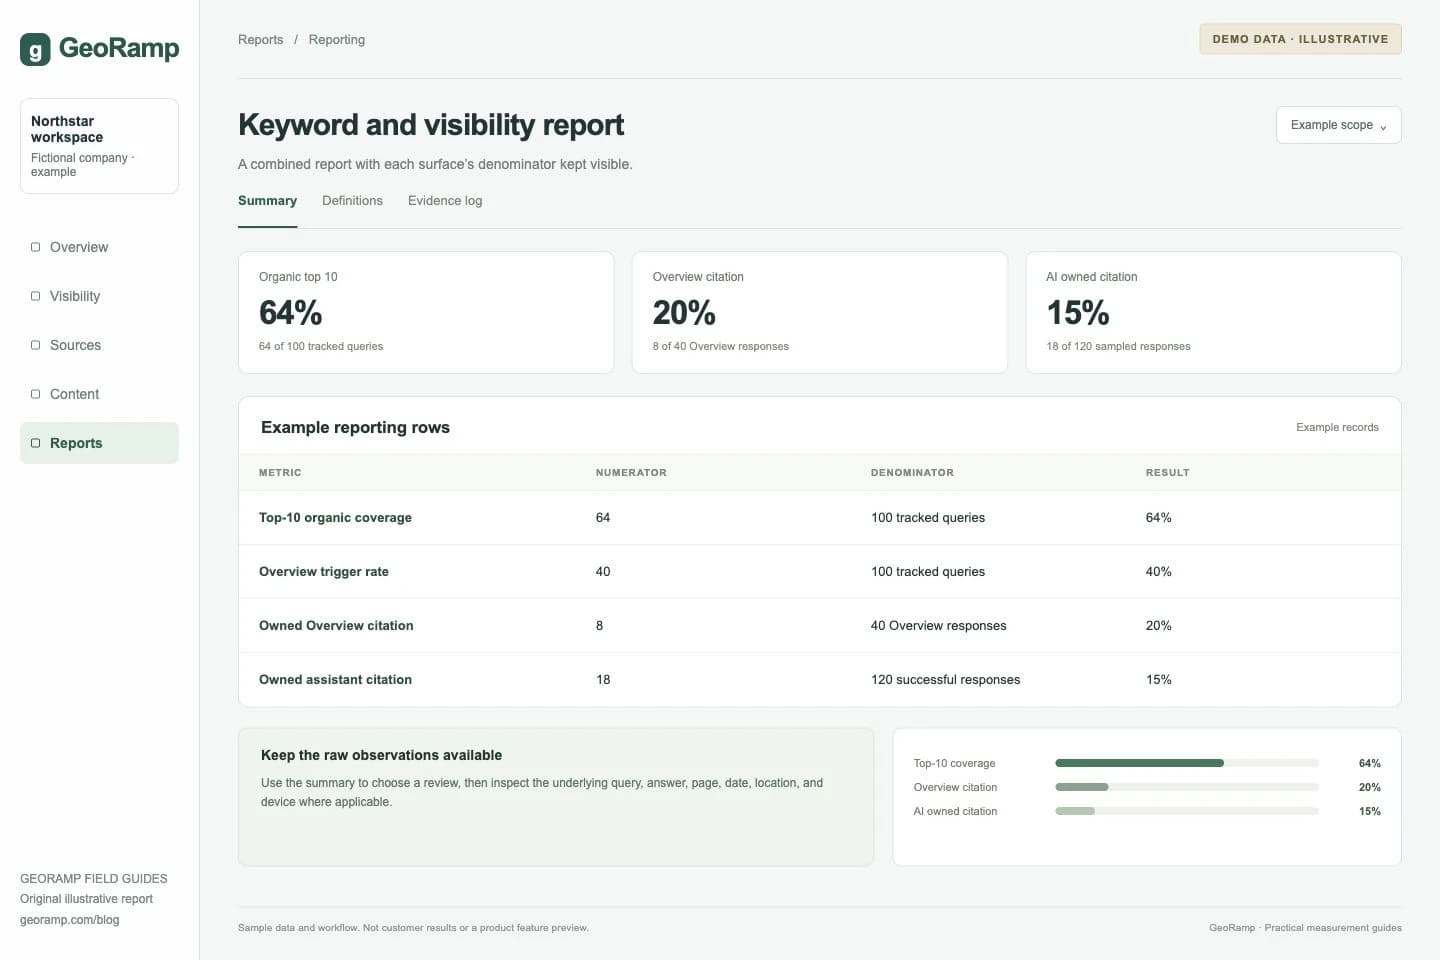
For every rate, show the numerator and denominator. In a fictional sample, 64 top-ten results out of 100 queries is 64% coverage. Eight citations among 40 observed Overviews is 20% conditional citation coverage. Eighteen owned-page citations among 120 assistant responses is 15%.
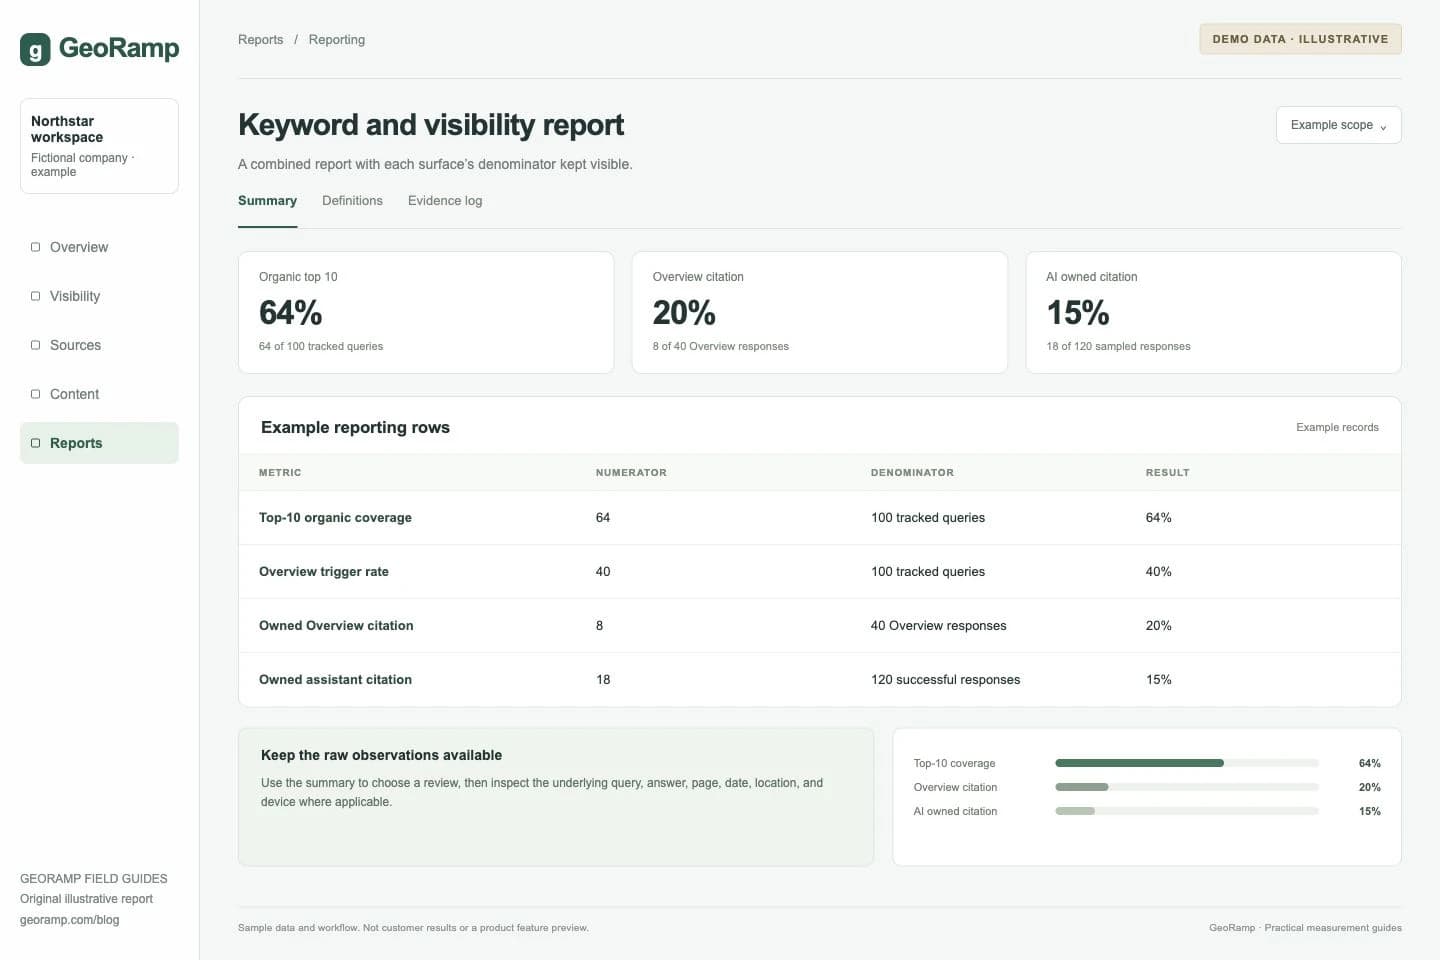
Illustrative report with fictional data and workflow examples. This is not a customer result or a preview of a specific product screen.
These percentages do not describe interchangeable shares. They should remain separate rows even when the executive version fits on one page.
Explain what average position can conceal
Averages can move when the query mix changes or new impressions arrive from queries where the site has weaker positions. Inspect the pages and query groups behind a movement before treating it as a uniform gain or loss.
A third-party rank observation and Search Console average position are also different datasets. Label them clearly. Avoid splicing one source into the other's trend because both fields contain the word “position.”
Include the evidence behind AI observations
Store the query or prompt, collection time, platform, mode, response status, and source URL. Link the evidence from the summary row where possible.
Google's dedicated generative AI performance report provides another first-party view where available. Use its actual dimensions and definitions rather than assuming it exposes the same details as a prompt tracker.
External-assistant observations and referral sessions belong in their own rows. A conversational query filter in ordinary Search Console data does not identify which searches used an AI interface.
End with a page-level decision
Use a short action field: evidence, interpretation, next change, owner, and review date. For example, “The deployment guide is visible organically but repeatedly absent from the sampled implementation answers. Inspect cited guides and document the missing prerequisite.”
Keep the interpretation tentative until the source review is complete. A percentage gap alone does not explain why a system selected another page.
Review at a useful cadence
Choose collection frequency based on the decision and cost. Use repeated observations for unstable outputs and longer review windows when small samples make weekly percentages noisy.
Maintain the raw data behind the compact report. The one-page view should help a reader decide where to investigate, while the detailed records make the conclusion auditable. See AI rank tracking for the measurement design and content gap analysis for the resulting briefs.