

A chart that adds ChatGPT users, Google AI Overview impressions, and Perplexity visits into one market-share pie has a denominator problem. Those measures describe different events, and the same person can appear in several of them.
For a B2B marketing team, the useful market question is narrower: which search and assistant experiences appear in your buyers' research, and where can you collect evidence that supports a decision?
Define the market before comparing numbers
Separate people, visits, queries, generated answers, and referral sessions. Weekly active users and monthly active users are different measures. An embedded search feature and a standalone assistant also have different distribution contexts.
When reading a market study, record its population, dates, geography, platform coverage, and collection method. Check whether mobile apps, logged-in activity, and enterprise usage are included. Keep overlapping usage estimates in separate columns rather than forcing them to sum to 100%.
Treat forecasts as forecasts. A projected decline in search volume does not become an observed result when its target year arrives. Look for the actual measurement and its methodology before using the number in a budget presentation.
Start with evidence from your own buyers
Ask sales to record where prospects first encountered the company and which tools they used to compare vendors. Preserve the wording when possible. “I researched with AI” is less useful than a named assistant and an example question.
Use analytics to inspect identifiable assistant referrals, while recognizing that not every visit retains a clean referrer. Combine those sessions with self-reported discovery and a small prompt study. None of these sources is complete on its own.
The example below is a proposed research plan, not an estimate of platform market share. It assigns different evidence sources to the questions a team needs to answer.
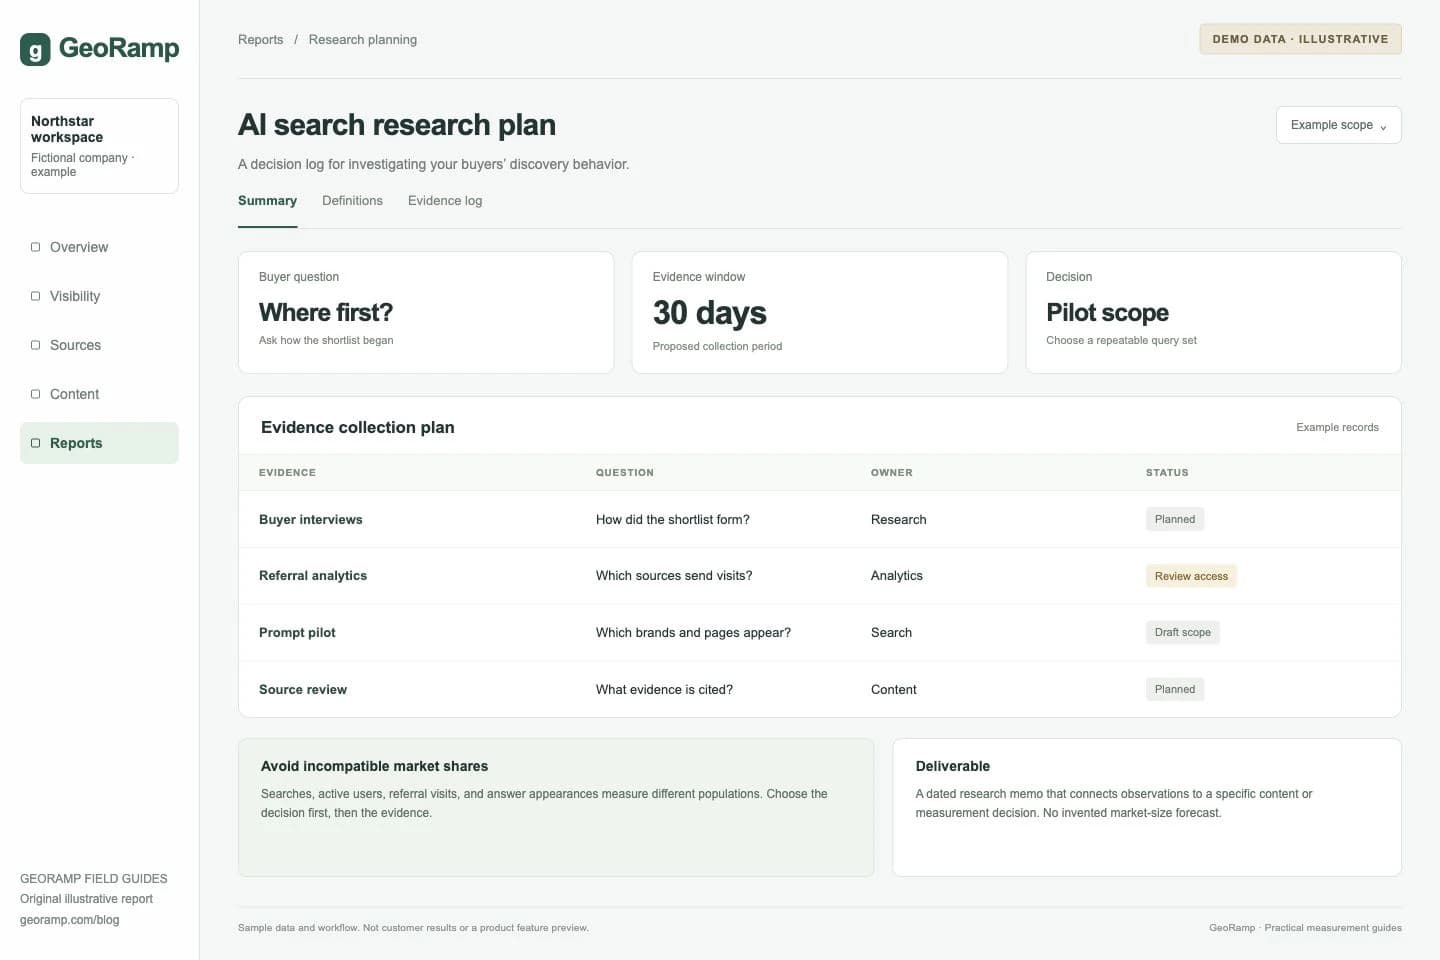
Illustrative report with fictional data and workflow examples. This is not a customer result or a preview of a specific product screen.
Choose a pilot with a clear boundary
Pick one product category, one audience, one language, and a small set of recurring buyer questions. Include category discovery, integration checks, competitor comparisons, pricing constraints, and migration concerns.
Test the platforms your buyers name first. Add a comparison platform when you have a useful hypothesis, such as whether its answers cite different source types. Record the mode used; an assistant with web retrieval enabled should not be pooled with responses generated without it.
Avoid building a monitoring program around every available platform just because a vendor supports it. Each additional surface adds collection cost and interpretation work. Expand when the results reveal a decision you could not make from the existing sample.
Separate the platform from the source ecosystem
An assistant may cite a review, documentation page, community discussion, or publisher article. Track those sources as well as the assistant's name. The practical opportunity may be improving your documentation, correcting a third-party listing, or answering a genuine question in a community you already participate in.
Do not assume one platform always prefers one content style. Check the actual source pages for your topic and repeat the observation. A platform-level stereotype can conceal differences between a technical question and a buying recommendation.
Use market research to set a test budget
Give the pilot a defined owner, collection cost, duration, and decision rule. A useful decision might be whether to add a dedicated comparison page or continue monitoring an integration topic. Set expectations around learning and execution before expecting attributable revenue.
Review the results with sales and content teams. If the monitored questions do not resemble real buying conversations, revise the sample before increasing spending. For a measurement design, see AI search visibility; for choosing software, use the AI visibility product buyer's guide.