
An AI SEO statistic is only useful if you can identify what was counted. “Visibility increased 40%” means little without the experiment, baseline, and definition of visibility behind it.
This article separates published observations from business assumptions. The figures below are dated research findings, not a current market forecast or a promise of results for your website.
Google AI summary clicks: what the study observed
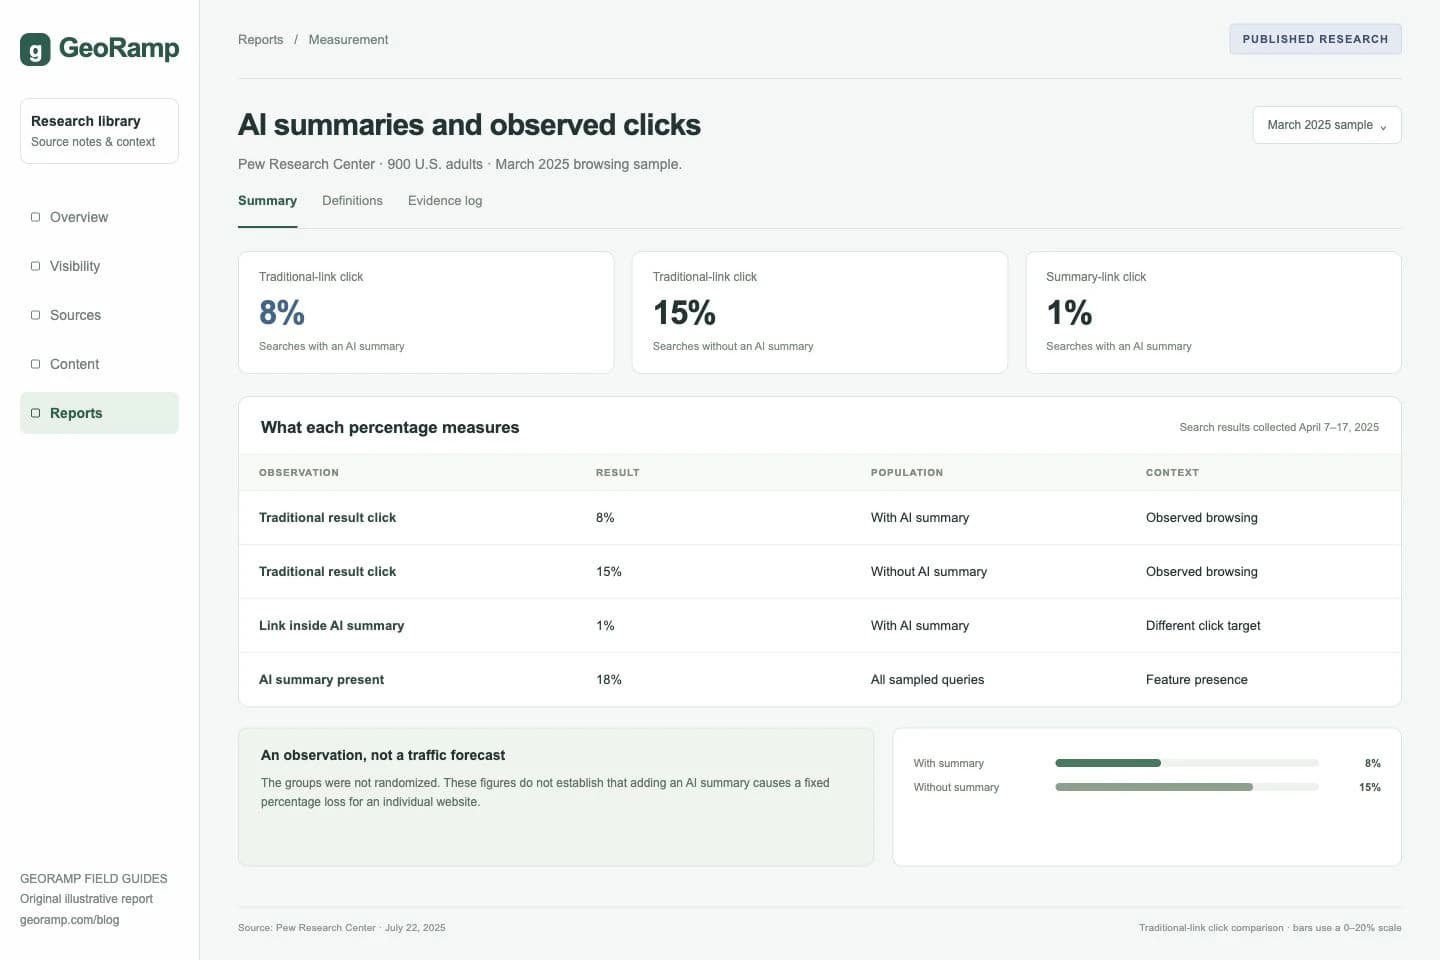
Pew Research Center's July 2025 analysis used browsing data from 900 U.S. adults during March 2025. Researchers subsequently collected results for the searches in April. That timing matters because results can change between a person's visit and a later observation.
| Observation in the study | Reported figure |
|---|---|
| Visits with an AI summary followed by a traditional-result click | 8% |
| Visits without an AI summary followed by a traditional-result click | 15% |
| Visits with an AI summary followed by a click on a summary link | 1% |
| Searches in the dataset producing an AI summary | 18% |
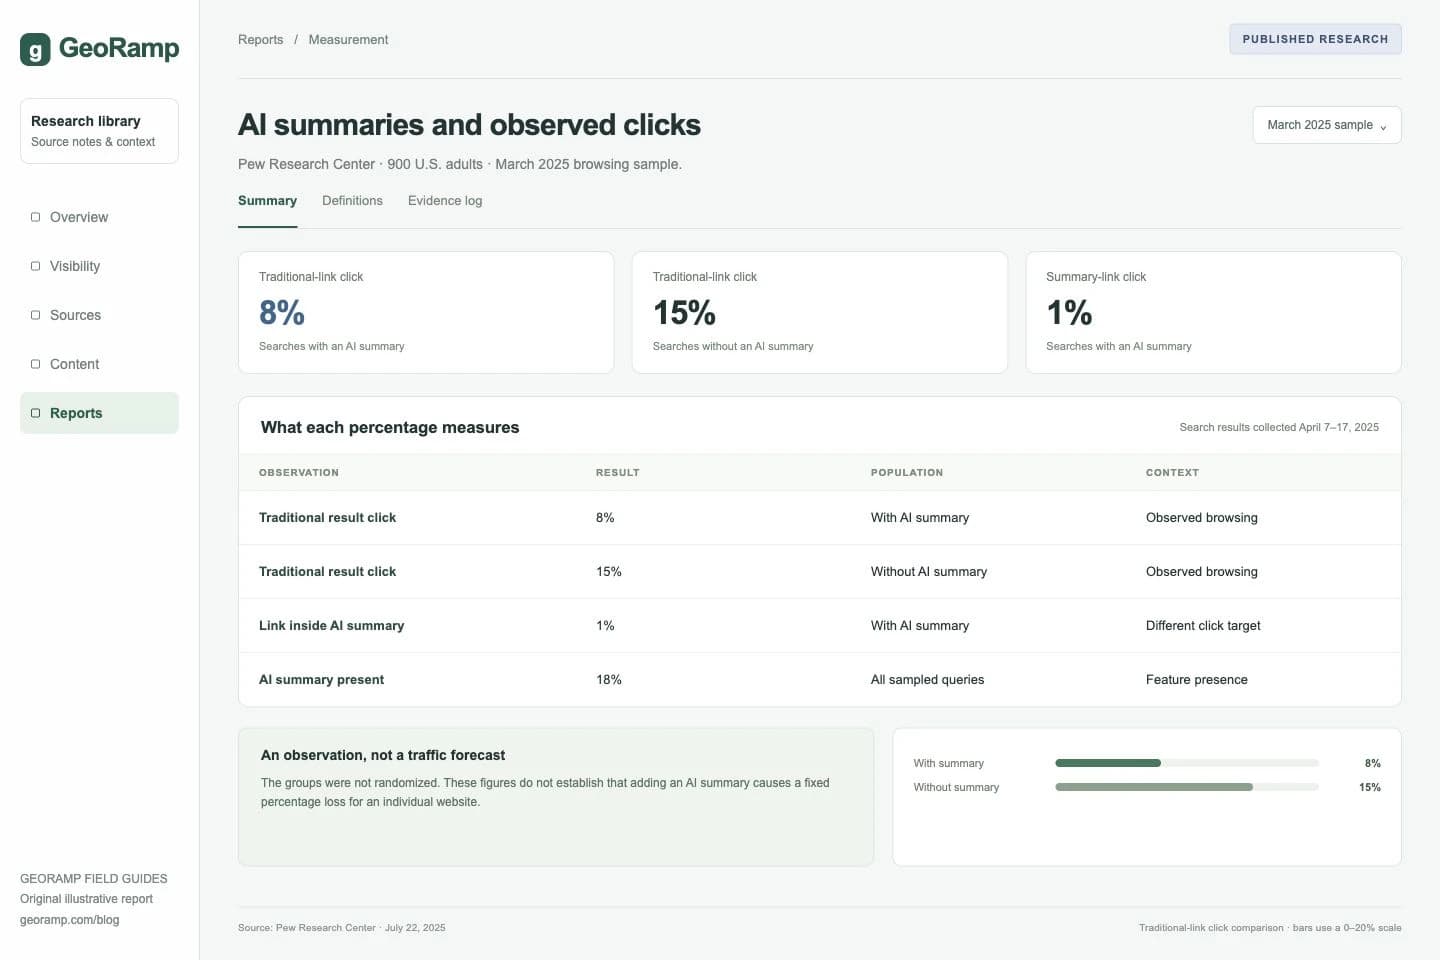
Research visualization based on Pew Research Center’s March 2025 browsing sample. Observational findings, not a forecast for an individual site.
The first two figures describe different groups of searches. Their seven-percentage-point difference is not a controlled estimate of the traffic a particular website lost. The 1% summary-link measure also uses a different event definition from a traditional-result click. Do not add or substitute these rates casually.
These findings support closer measurement of click behavior. They do not establish what a B2B software category's October 2026 click-through rate should be.
GEO research: an experimental result, not a ranking guarantee
The GEO paper introduced a framework for studying how source-page modifications affect visibility in generated answers. Its abstract reports improvements of up to 40% under the evaluated conditions, with effects varying by domain.
That is not a universal 40% lift from adding citations, nor evidence that every current assistant uses the same selection process. The paper's visibility measures and experimental system should be read before turning a result into a marketing claim.
Useful hypotheses include whether a clearer explanation, supported fact, or well-attributed source helps a page answer the target question. Test those changes on your own content. Avoid converting the study into fixed “citation lift” percentages for schema, author bios, or tone when the cited evidence does not establish them.
Keep relative changes and percentage points distinct
Suppose an illustrative appearance rate moves from 10% to 14%. That is an increase of four percentage points and a relative increase of 40%. It is not an increase of 40 percentage points.
The counts also matter. One additional appearance in a tiny sample can create a large relative change. A report should show the numerator, denominator, collection period, and any failed runs alongside the rate.
If a baseline is zero, a conventional relative percentage increase is undefined. Report the new count and rate directly instead of displaying an infinite improvement.
Build an evidence ledger for your team
For each external statistic, store the original source URL, publication date, observation dates, population, numerator, denominator, and any caveat that affects interpretation. Note whether the source is a platform disclosure, observational study, experiment, survey, or forecast.
Assign a review date to time-sensitive figures. Do not silently replace an old number while leaving an old chart and headline in place. If two studies disagree, compare their samples and definitions before choosing the more dramatic result.
For internal examples, label dummy data visibly in the image and caption. An illustration should explain a calculation without being mistaken for customer evidence.
Use the numbers to define a measurement question
Instead of forecasting revenue from a headline statistic, ask which uncertainty your team can reduce next. Can you measure assistant referrals? Can you repeat a stable prompt sample? Can you identify which source pages answer the buyer's question?
Our AI visibility measurement guide and Search Console reporting guide explain how to collect those observations. Your own reliable baseline is the starting point for evaluating an investment.