
Your domain receives 80 citations, but 70 point to one glossary page. A domain total hides the dependence on that page and tells you little about whether buyers encounter the product during evaluation.
Citation analysis connects individual answers to the source pages they cite. Its purpose is to explain the pattern well enough to choose a useful action, not merely to count links.
Preserve the unit of observation
Keep a record for each response: prompt ID, assistant, mode, language, time, raw answer, and source URLs. Record whether the collection succeeded. Retain original URLs even if you also store normalized URLs for grouping.
Decide how repeated links count. A page cited twice in one answer can be two citation events or one response containing that page. Either convention can work if it is explicit and consistent.
Keep a brand mention separate from a citation to its site. An answer can recommend the brand using a third-party review as its evidence. That is commercially relevant, but it is a different observation from an owned-page citation.
Read the data at three levels
At the prompt level, identify which buying tasks produce useful coverage. At the page level, identify the URLs carrying that coverage. At the platform level, check whether differences persist under comparable collection conditions.
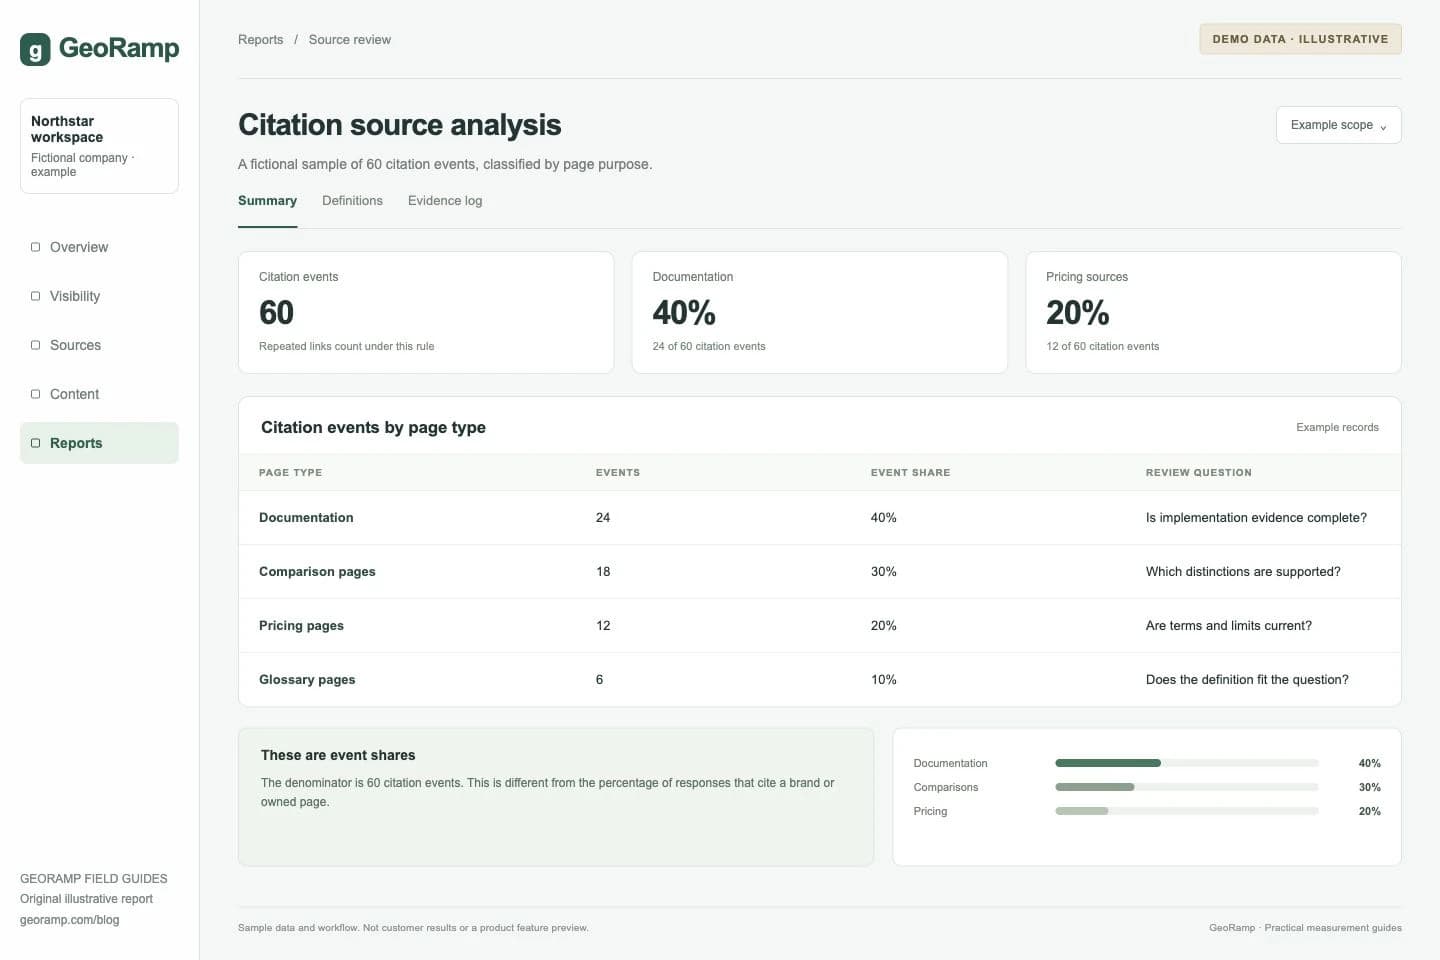
The illustrative report below contains 60 citation events across four source-page groups. Product documentation accounts for 24, or 40% of those events. That event share should not be relabeled as a share of users or a response appearance rate.
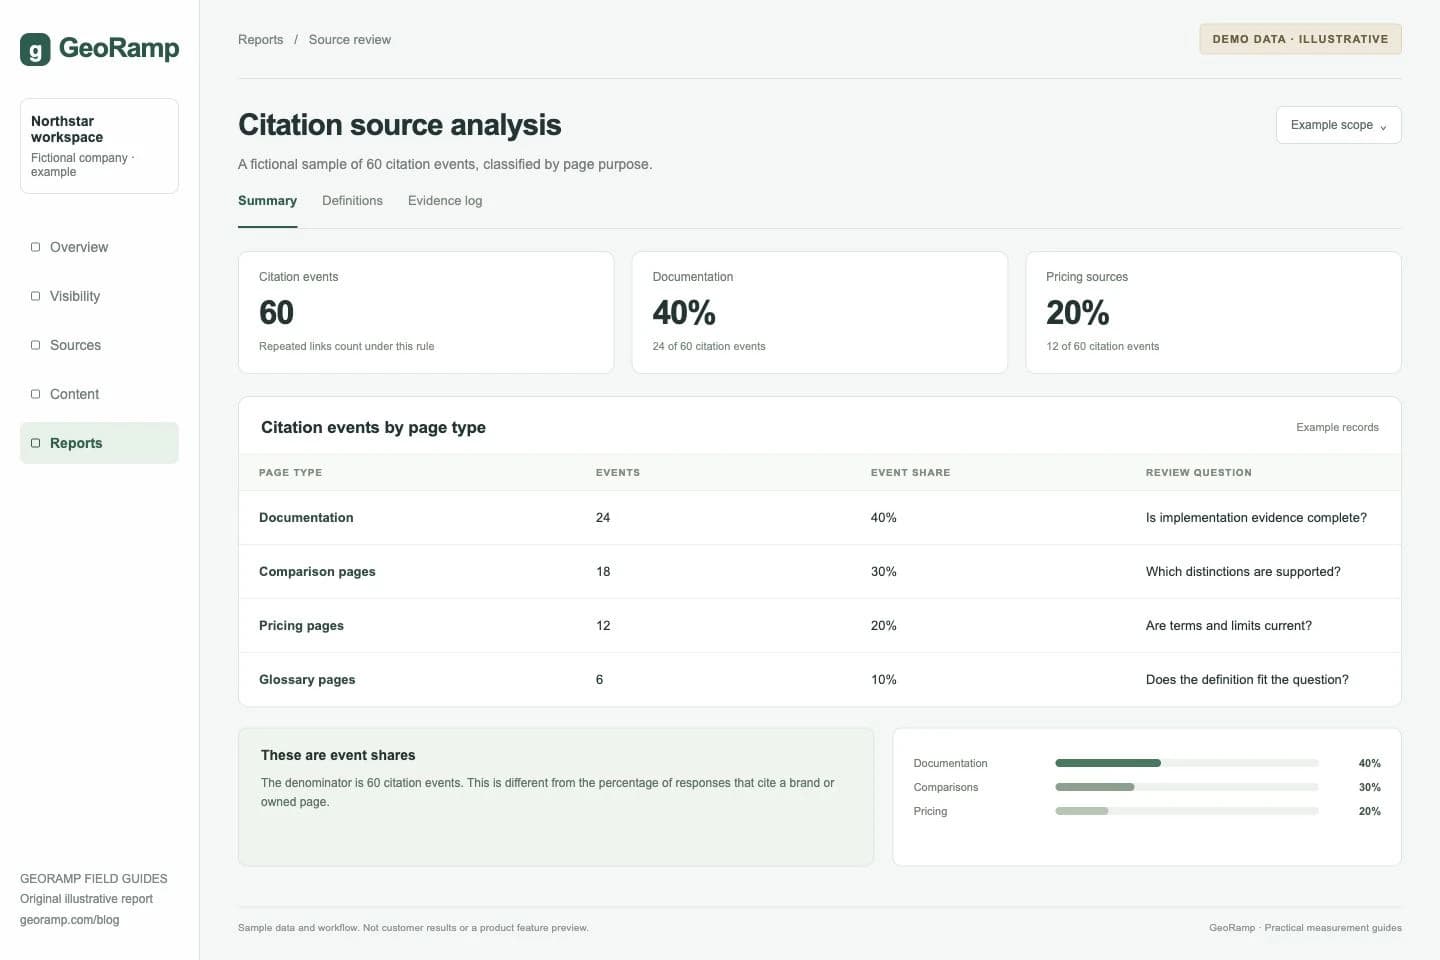
Illustrative report with fictional data and workflow examples. This is not a customer result or a preview of a specific product screen.
Investigate source concentration
Sort owned pages by their contribution to citation events and by the number of distinct questions they support. A single page cited for many related prompts may be doing its job well. It may also be a dependency that needs careful maintenance.
Check the facts on highly cited pages before adding more content. A stale limitation or broken link on a frequently cited source can matter more than a missing low-priority article.
When a page is absent, inspect the cited alternatives. They may answer a different subquestion, offer a more precise source, or contain evidence your site lacks. Avoid concluding that a cosmetic similarity explains their selection.
Choose between manual analysis and software
A spreadsheet can support a small sample when you preserve raw observations and use consistent coding rules. It becomes harder to maintain as platforms, repeated runs, and source URLs multiply.
When evaluating software, ask whether you can export the answer-level records, distinguish failed runs, inspect normalized URLs, and recover the exact sample behind a summary. Compare the available evidence before comparing the visual design of the dashboard.
Our tool comparison covers several product categories. The right tool depends on the collection and review workload, not a universal leaderboard.
Convert a finding into a narrow task
Suppose deployment documentation receives citations while a pricing question repeatedly cites an external summary. Review whether your pricing page clearly states units, limits, and exceptions. If not, fix that explanation and record the change.
Do not add statistics merely because a chart suggests “factual density” correlates with visibility. A fact should help answer the question and have a source. Unsupported figures make the underlying page less trustworthy.
Repeat the original sample after changes and compare both rates and source substitutions. A movement can result from a content edit, changes in competing sources, or platform behavior. Keep the interpretation proportional to the evidence.
Use the AI visibility guide for rate definitions and the content gap template to document the resulting editorial tasks.