

A dashboard reports 18% "AI share of voice," but its denominator is every answer collected. Another reports 18% of all tracked brand appearances. Those percentages answer different questions, even though their labels look identical.
Before calculating share of voice, define the event being counted, the competitive set, and the sampling period. This guide covers the formulas, worked examples, and denominator mistakes that make reports hard to compare.
Key Takeaways
-
Competitive SOV is your brand's count divided by the combined count for the defined competitive set, including your brand.
-
Paid impression share uses estimated eligible impressions. AI answer appearance rate uses sampled answers. Neither is an additive competitive market share.
-
Keep channel metrics separate and compare like-for-like samples over time.
-
A visibility gap is a reason to investigate. It does not establish which investment will produce the best return.
The Share-of-Voice Formula
For a count-based competitive metric:
SOV = Your brand's count ÷ Combined count for the tracked competitive set × 100
The numerator and denominator must use the same event, time period, filters, and collection method. The denominator includes your brand. A report covering four brands describes those four brands, not the entire market.
Document the scope before calculating. For social listening, that includes brand aliases, ambiguous names, topic filters, platforms, and how duplicates are handled. For search, document the keyword set, location, device, and estimation method. Changing these inputs can change the percentage without any change in brand performance.
Choose competitors buyers actually consider. You can maintain separate direct-competitor and broader-category reports, but label the sets and avoid switching between them mid-trend.
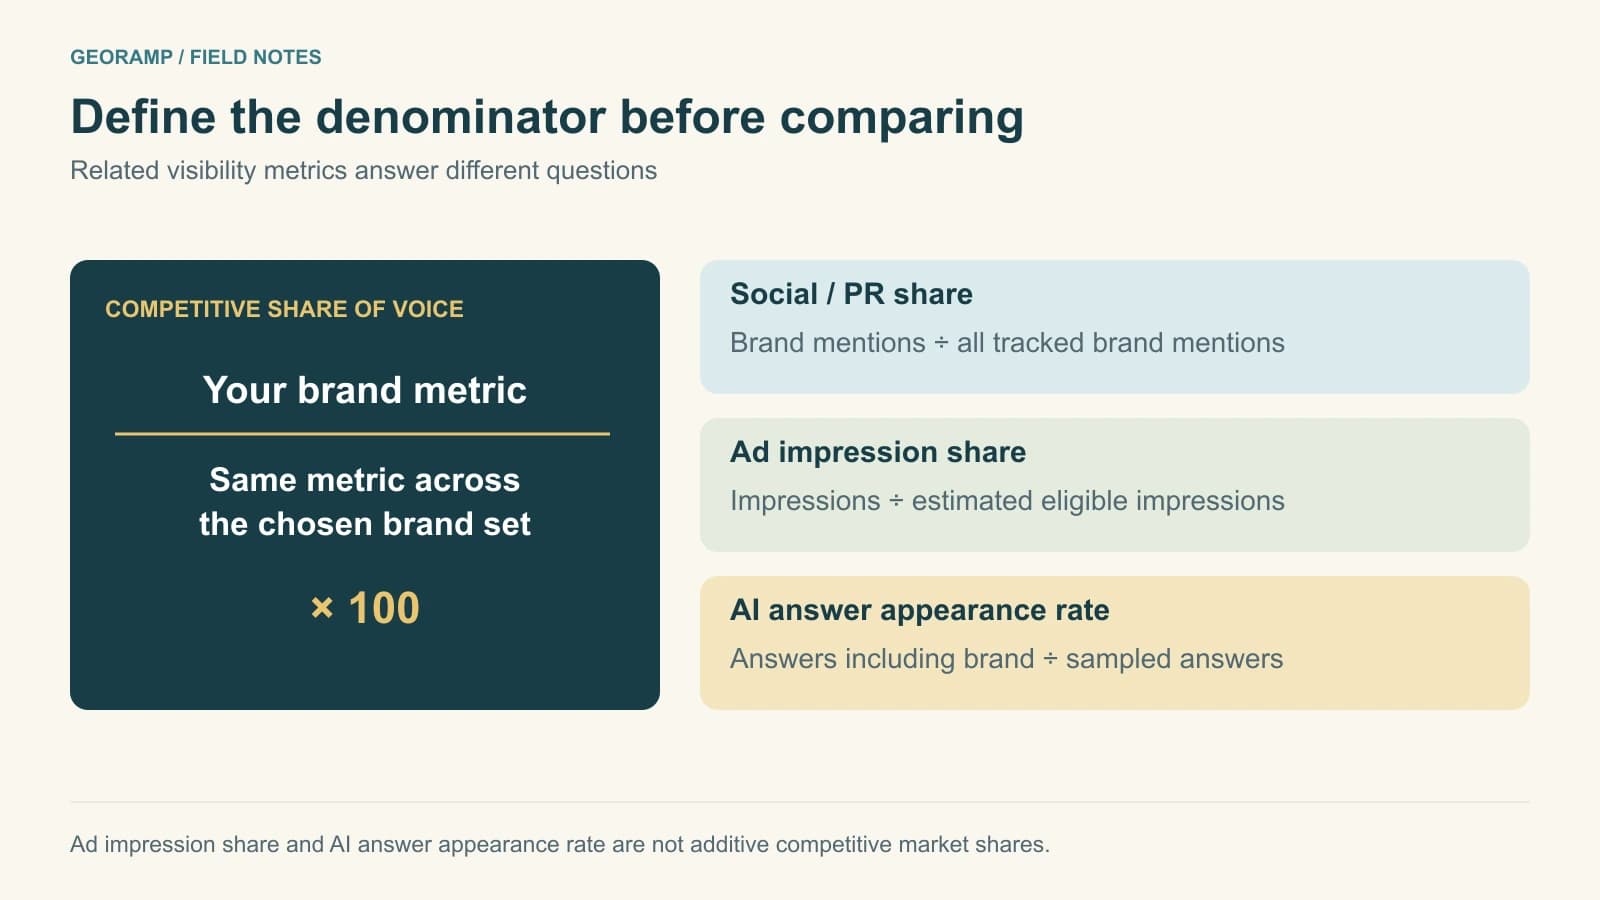
Define the denominator for every metric. Paid impression share and AI answer appearance rate are not additive competitive market shares.
Organic Search: Estimated Traffic Share
One approach estimates traffic from a fixed keyword set using search volume and a position-based click-through-rate assumption:
Estimated keyword traffic = Search volume × Assumed CTR at the observed position

Organic SOV = Your summed estimated traffic ÷
              Summed estimated traffic for all tracked brands × 100
This is an estimate, not observed site traffic. Its usefulness depends on the keyword sample and CTR assumptions. A branded keyword set answers a different question from a set of unbranded buying queries.
For an illustrative calculation, your brand has 1,200 estimated visits from the tracked set and the combined total is 10,000. Your estimated traffic share is 12%. Keep the weighting method constant when comparing periods and disclose material changes to the sample.
Paid Search: Impression Share
Google Ads defines impression share as impressions received divided by estimated impressions the ads were eligible to receive:
Impression share = Received impressions ÷ Estimated eligible impressions × 100
If you received 400 impressions from an estimated 1,000 eligible impressions, impression share is 40%. Eligibility depends on factors such as targeting, approval status, and quality.
This is not your fraction of every impression in the market. Different advertisers can have different eligibility, so their reported impression shares do not need to sum to 100%. Use matching campaign scope when comparing reports. Investigate lost impression share and campaign economics before concluding that a higher share is worth buying.
Social and PR: Share of Tracked Mentions
For an unweighted mention count:
Mention SOV = Your qualifying mentions ÷
              All qualifying mentions for the tracked brands × 100
Use the same inclusion rules for every brand. Decide how to handle reposts, duplicate stories, paid placements, and irrelevant uses of a brand name.
Report sentiment alongside volume or calculate shares within separate positive, neutral, and negative segments. A spike caused by an outage can increase mention share while harming the business. If you use weighting, disclose the nonnegative weights and apply them consistently. Do not quietly mix sentiment scores into a count-based denominator.
AI Search: Appearance Rate Versus Competitive Share
First decide whether you are counting a named brand or a linked source. They are separate observations. Our AI citations guide explains the distinction.
For answer-level brand appearance:
Brand appearance rate = Responses naming your brand ÷
                        Successful sampled responses × 100
If 27 of 150 successful responses name your brand, the rate is 18%. Count each response once for each brand, regardless of how many times the name appears. Multiple brands can appear in one answer, so their rates can sum above 100%.
An own-domain citation rate uses the same answer denominator, with responses linking to your domain as the numerator. A citation to a third-party review is not an own-domain citation.
For a competitive brand-appearance share, use a different denominator:
Competitive AI SOV = Your brand's answer-level appearances ÷
                     Answer-level appearances summed across all tracked brands × 100
For example, your brand appears in 27 responses and all tracked brands have 90 appearances combined. Your competitive share is 30%, even though your appearance rate is 18%. These shares sum to 100% across the defined set when the same counting rules are used.
Save the prompt set, assistants, modes, collection dates, and failures. Separate branded and unbranded prompts. Pooling samples is only interpretable if you explain the weighting; an assistant with more runs otherwise contributes more to the aggregate.
Worked Example: A Boutique Hotel
The brands and figures below are illustrative data. An independent hotel compares review-site mentions and local-press coverage against three nearby competitors during one quarter.
| Brand | Review-site mentions | Local-press mentions | Total |
|---|---|---|---|
| Wisteria Inn | 14 | 22 | 36 |
| The Heron House | 21 | 47 | 68 |
| Marlowe Suites | 9 | 17 | 26 |
| Forbes & Field | 6 | 14 | 20 |
| Tracked set total | 50 | 100 | 150 |
Wisteria Inn's combined mention share is 36 ÷ 150 × 100 = 24%. The Heron House leads at roughly 45.3%.
The channel split is more informative. Wisteria has 28% of review-site mentions (14 ÷ 50) and 22% of local-press mentions (22 ÷ 100). The Heron House has 42% and 47%, respectively. Wisteria's gaps to the leader are therefore 14 percentage points on reviews and 25 points in local press.
The combined count gives each mention equal weight and lets the higher-volume press channel contribute more. It does not show that press has a better return. Investigate audience relevance and resulting inquiries before using those gaps to allocate budget.
Worked Example: A SaaS Channel Report
A fictional project-management company uses the following illustrative percentages. Each row has its own denominator; the figures should not be averaged into one SOV score.
| Metric | Your brand | Comparison brand | Gap in percentage points |
|---|---|---|---|
| Organic estimated traffic share | 12% | 38% | 26 |
| Paid impression share | 23% | 41% | 18 |
| Social mention share | 9% | 29% | 20 |
| AI answer appearance rate | 18% | 31% | 13 |
Compare organic and social shares within the same tracked sets. The paid row compares eligibility-based measures, while the AI row compares appearance rates in the same answer sample. The smallest gap does not establish which channel offers the highest return.
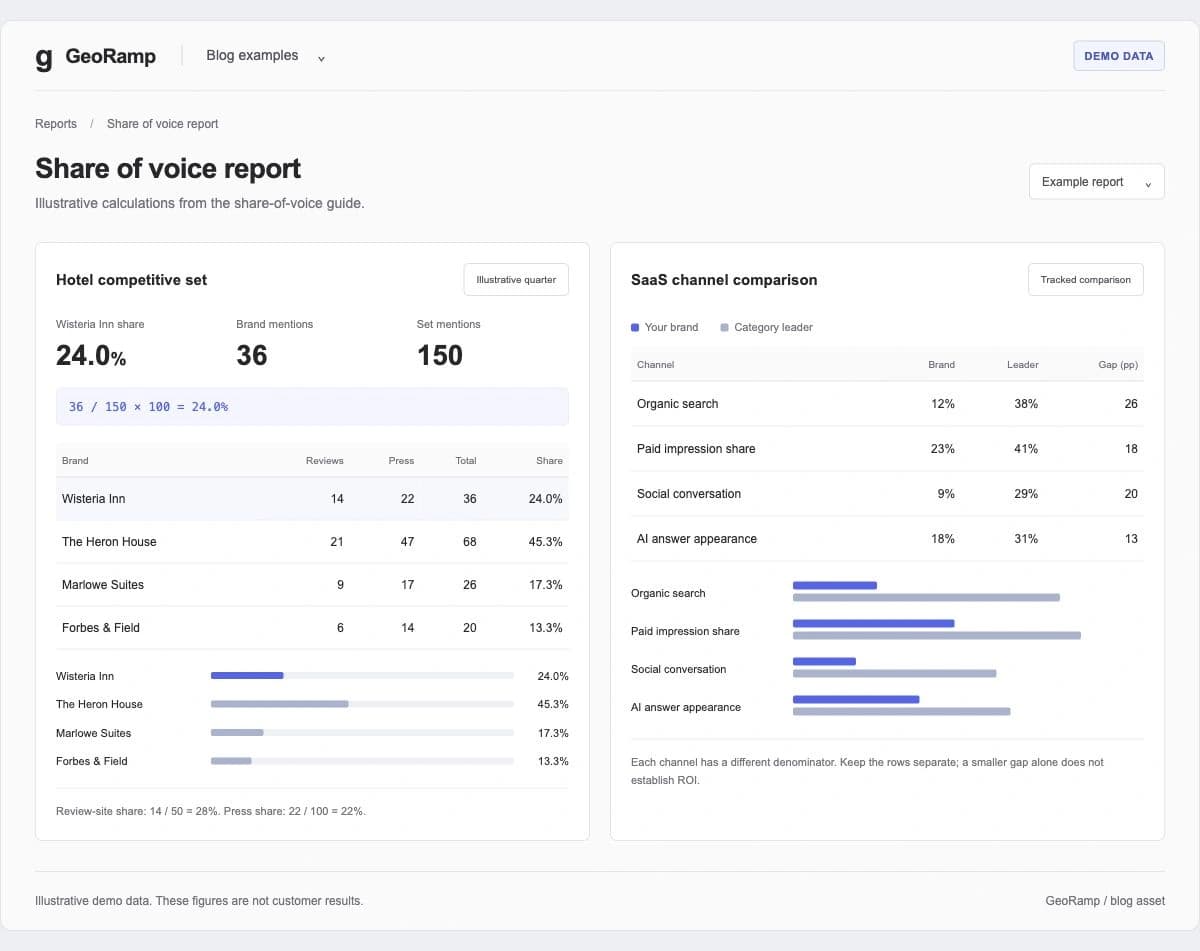
Illustrative report styled to match GeoRamp. All figures come from the sample tables above; this example report is not a customer result or an existing product feature.
Excess Share of Voice
Excess share of voice is the difference between SOV and market share:
ESOV = SOV − Market share
A brand with 22% SOV and 18% market share has an ESOV of positive 4 percentage points. Use compatible definitions of category, geography, and period. State whether the underlying SOV is based on advertising spend, impressions, or another measure.
Subtracting sales market share from an AI appearance rate does not automatically create a comparable ESOV measure. Nor does a positive difference guarantee future market-share growth. Forecasts require evidence beyond the subtraction.
Make the Report Support a Decision
Show the count and denominator next to the percentage, the change from a comparable previous period, and the most relevant segment. Keep channel metrics distinct. Add an explanation when the competitive set or collection method changes.
Choose a reporting cadence based on the decision and available sample. Campaign monitoring may need frequent updates. A content program can review repeated AI samples and source URLs over a longer window. There is no universal cadence that makes a small or inconsistent sample reliable.
Use a gap to investigate a specific issue. A missing answer on an implementation page can lead to an editorial task; our content optimization guide provides a process. A high mention share during an outage calls for a different response. Bring cost, audience fit, leads, and conversion data into investment decisions rather than treating visibility as revenue.
Check how your brand appears in AI answers
Start with a defined question set and compare brand mentions and linked sources.
Check my visibility →