
A dashboard averages organic visibility, paid impression share, and AI appearance rate into “18% marketing share of voice.” That number looks simple, but its components may describe different populations and overlapping audiences.
A useful marketing SOV report can show several channels together without pretending their metrics are interchangeable. Preserve the channel definitions and use the comparison to decide where to investigate.
Define the business scope first
Choose the product category, audience, geography, competitor set, and reporting period. State why each competitor is included. Keep a stable comparison set for trends and annotate deliberate changes.
Define what you are counting in each channel. Social and PR may use deduplicated mentions. Organic visibility may use an estimated click model over a keyword set. Paid impression share uses eligible auctions. AI appearance rate uses sampled responses.
Keep the original rows visible
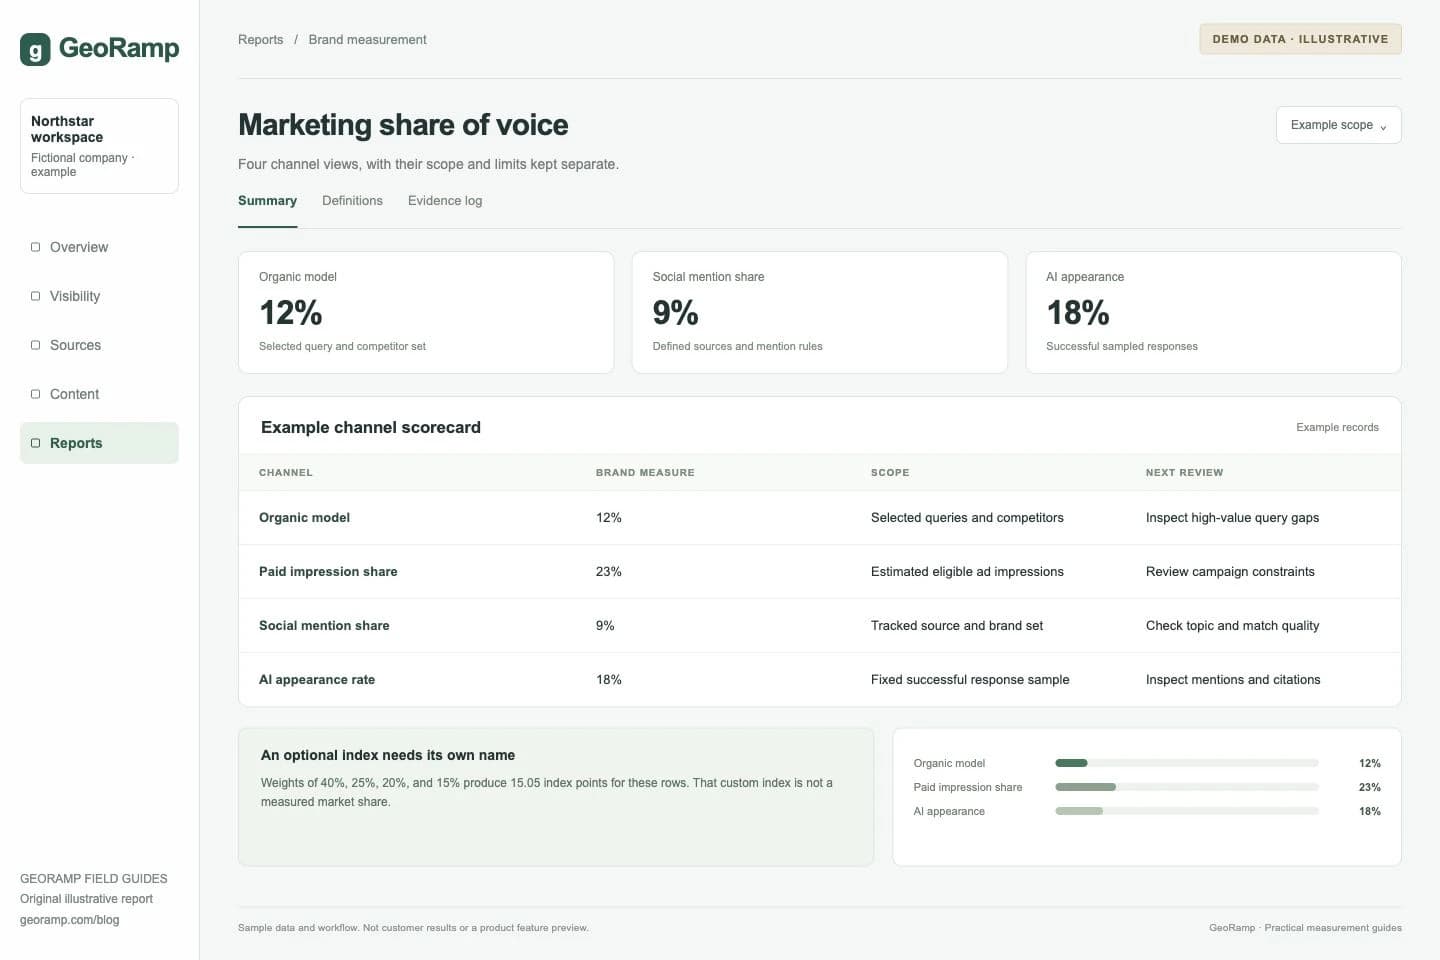
In this illustrative report, the brand has 12% organic visibility, 23% paid impression share, 9% social mention share, and an 18% AI answer appearance rate. Those values are useful only with their separate definitions.
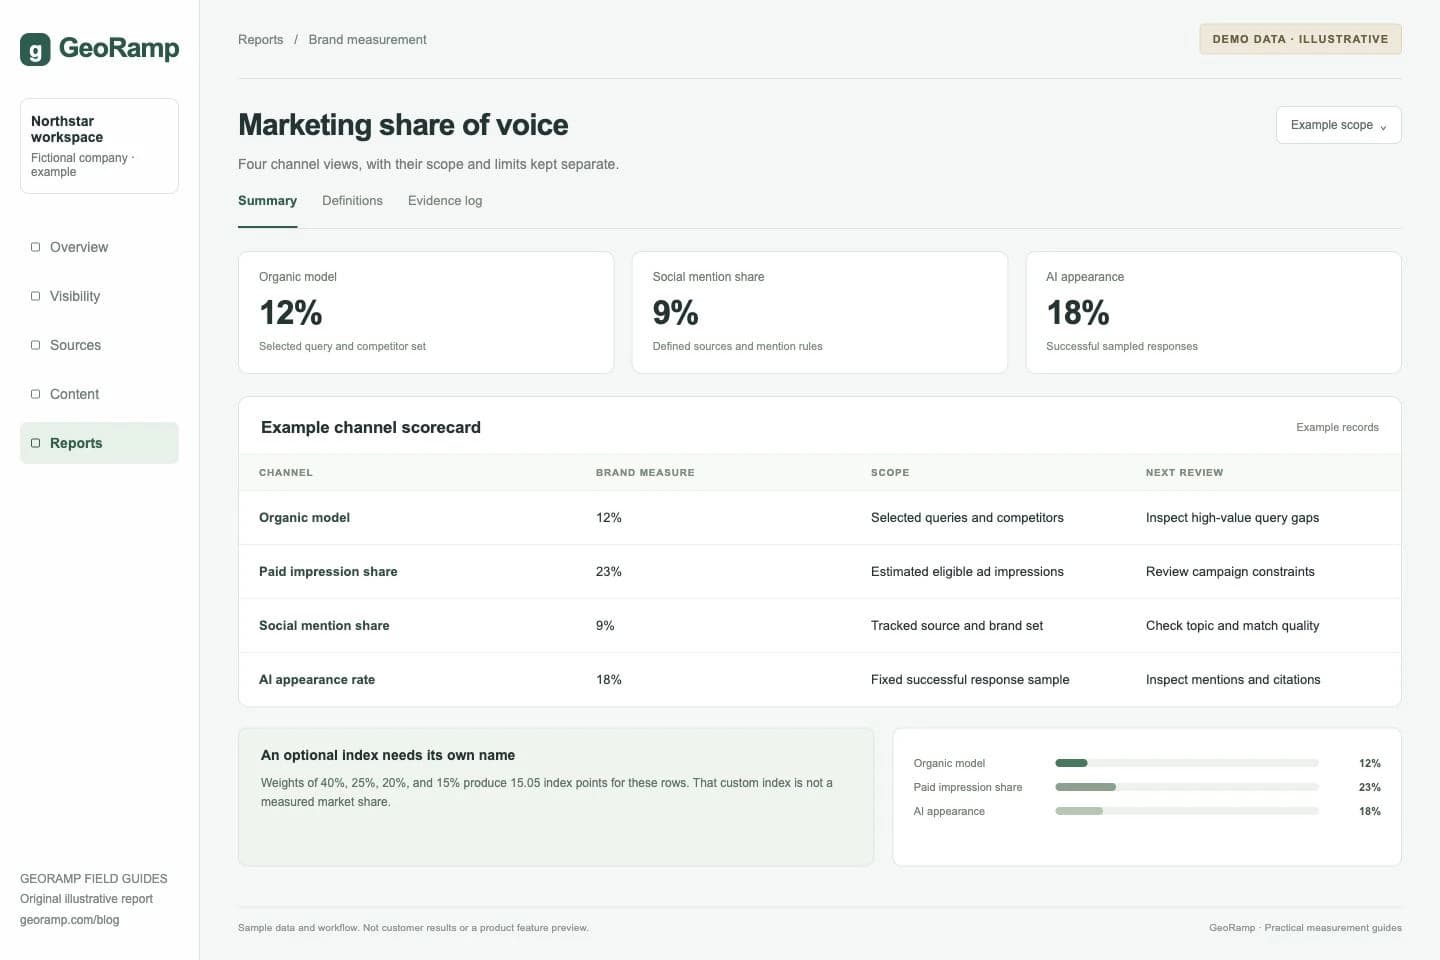
Illustrative report with fictional data and workflow examples. This is not a customer result or a preview of a specific product screen.
Compare each row over time using the same source and scope. If the leader differs by channel, name the leader in each row rather than implying one competitor owns every benchmark.
Do not sum raw impressions, social mentions, and generated answers. They are different events. A single buyer may also encounter several channels, so adding channel audiences can double-count people.
If you need an index, call it an index
An internal weighted index can help planning if the weights represent an explicit judgment and remain stable. It does not become market share because its display includes a percent sign.
For example, weighting the four illustrative rates by 40%, 25%, 20%, and 15% gives 15.05 points. The arithmetic is reproducible, but the result is a planning index determined partly by the chosen weights. It is not evidence that the brand captured 15.05% of all attention.
Publish the formula and retain the component rows. Check whether a change in the index comes from a real channel movement, a revised weight, or a changed measurement sample.
Connect the report with business evidence
Add a compact view of identifiable qualified traffic, inquiries, and sales feedback. Keep attribution definitions consistent. A channel's visibility measure should not be relabeled as pipeline contribution without a defensible connection.
Use the report to ask focused questions. A weak AI row may justify inspecting the cited pages for high-value prompts. A weak paid row may justify checking auction eligibility, economics, and lost impression share. Those lead to different actions.
Do not manufacture ESOV from incompatible measures
Excess share of voice is a comparison between a defined share of voice and share of market. An arbitrary cross-channel index and a revenue share do not automatically form a meaningful ESOV calculation.
Use the market share versus SOV guide to decide whether the scopes and measures are comparable. Keep an unvalidated index out of growth forecasts.
Make the executive view actionable
End with the largest relevant gap, the evidence needed to explain it, a proposed action, and an owner. Include uncertainty and sample changes where they affect the decision.
Use the one-page SOV report for presentation and the measurement guide for collection and quality control. The report should help allocate attention, not hide uncertainty behind one attractive number.