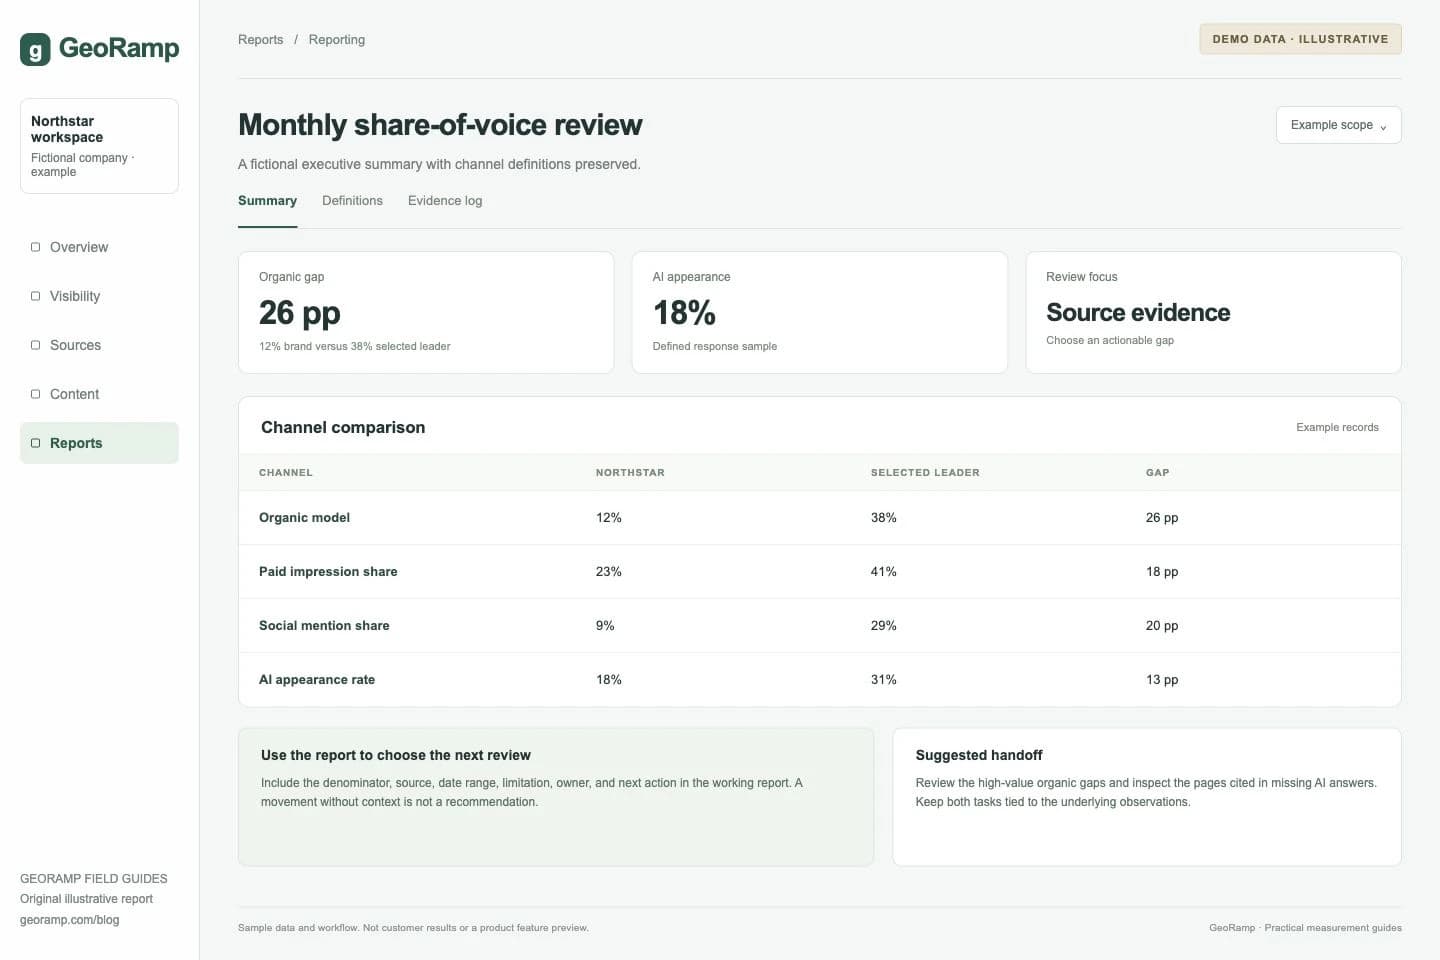

A report says the brand trails the leader by 26 points. The useful next sentence explains which metric, which competitor set, and what the team will investigate. Without that context, the gap is just decoration.
Use a one-page SOV report to direct attention to a decision. Keep the detailed observations available behind it so the summary can be challenged and reproduced.
Download the SOV report CSV. Its sample rows are illustrative, with separate definitions for each channel.
Put scope above the comparison
State the category, audience, competitor set, geography, reporting period, comparison period, and data sources. Flag any change in collection method or included sources.
Define each metric beside its row. A paid impression share and an AI answer appearance rate should not be labeled as though they count the same event. Use the measurement guide to establish collection rules before filling the report.
Show the gap with its denominator
The fictional example compares a brand and a channel leader across four metrics.
| Channel metric | Brand | Leader | Gap |
|---|---|---|---|
| Modeled organic visibility | 12% | 38% | 26 percentage points |
| Paid impression share | 23% | 41% | 18 percentage points |
| Social mention share | 9% | 29% | 20 percentage points |
| AI answer appearance rate | 18% | 31% | 13 percentage points |
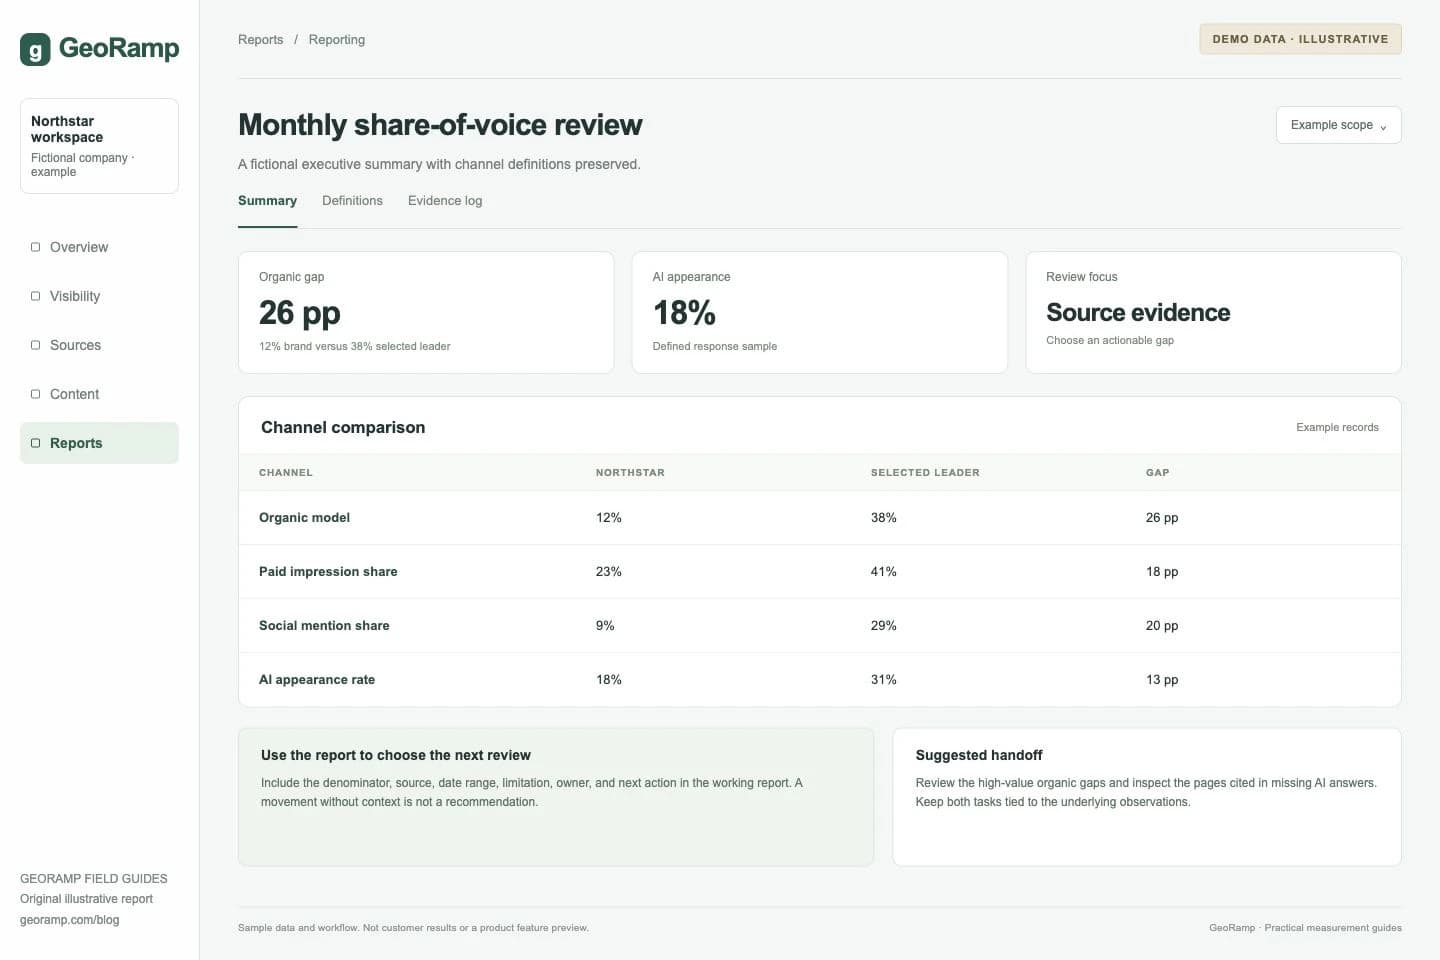
Illustrative report with fictional data and workflow examples. This is not a customer result or a preview of a specific product screen.
The rows have different denominators. They should not be summed or treated as comparable slices of one audience. If the leader differs by channel, record the actual leader for each row.
Keep change and gap separate
The gap compares your brand with a competitor in the current period. The change compares your brand with itself across periods. A brand can improve while the competitive gap widens if the leader improves faster.
Use percentage points for differences between rates. Moving from 12% to 15% is a three-point increase and a 25% relative increase. Choose the expression that answers the decision clearly and avoid switching between them to make a result sound larger.
Show underlying counts when the sample is small. One additional response can move an appearance rate sharply without providing strong evidence of a durable change.
Add a short evidence note
Link to the source records or the relevant detailed report. Describe the main observation and the uncertainty around its interpretation. Keep factual observations separate from hypotheses.
For example: “The same integration questions repeatedly cite documentation that includes a prerequisite absent from our guide.” That is more actionable than “We need more authority.”
If a data source failed or the sample changed, make that visible in the summary rather than burying it in an appendix.
End with an owned action
Name the next task, owner, intended release date, and review condition. A useful task is small enough to complete and specific enough to verify: update the guide, correct a listing, review auction eligibility, or investigate source quality.
Allow “no action” when the evidence does not justify a change. The report's value is better judgment, not a compulsory new task for every red cell.
Keep the reporting cycle proportionate
Collect at a frequency that supports the decision and review trends over enough observations to reduce noise. Preserve raw data even when the executive view stays compact.
For cross-channel interpretation, use marketing share of voice. For simple formulas and a transparent example, use the SOV calculator.