

A brand can be widely discussed and still sell little in the category. Share of voice describes a defined form of attention or advertising presence; share of market describes a defined portion of sales or units.
The two measures can be useful together, but only after their market, period, geography, and units are explicit. A gap between them is a planning signal to investigate, not a promise that sales will catch up.
Define each measure
Revenue market share divides the brand's category revenue by total category revenue. Unit market share uses units instead. The two can differ when prices vary, so state which one you mean.
Share of voice needs an equally clear definition. It might refer to advertising spend, comparable impressions, or qualifying mentions. Each definition describes a different dataset and has different collection limits.
| Measure | Numerator | Denominator |
|---|---|---|
| Revenue market share | Brand category revenue | Total category revenue |
| Unit market share | Brand units sold | Total category units sold |
| Advertising spend share | Brand category ad spend | Total category ad spend |
| Mention share | Brand qualifying mentions | Qualifying mentions across the defined set |
Work through a compatible example
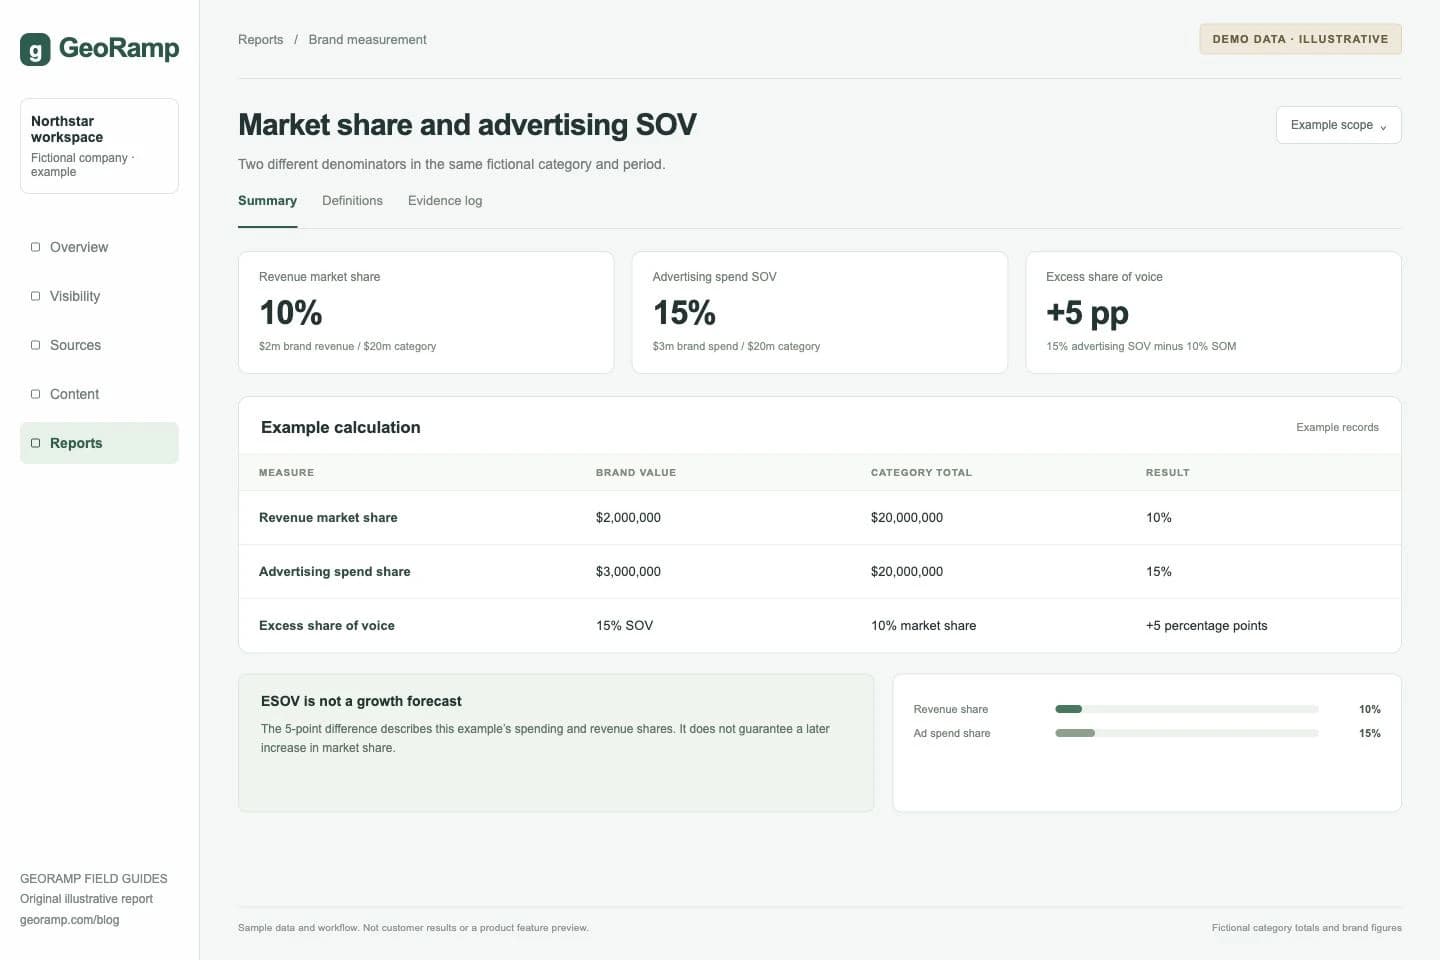
Suppose a fictional brand earns $2 million in a $20 million category during the same year and geography. Its revenue market share is 10%. Suppose it also accounts for $3 million of $20 million in measured category advertising spend. Its advertising spend share is 15%.
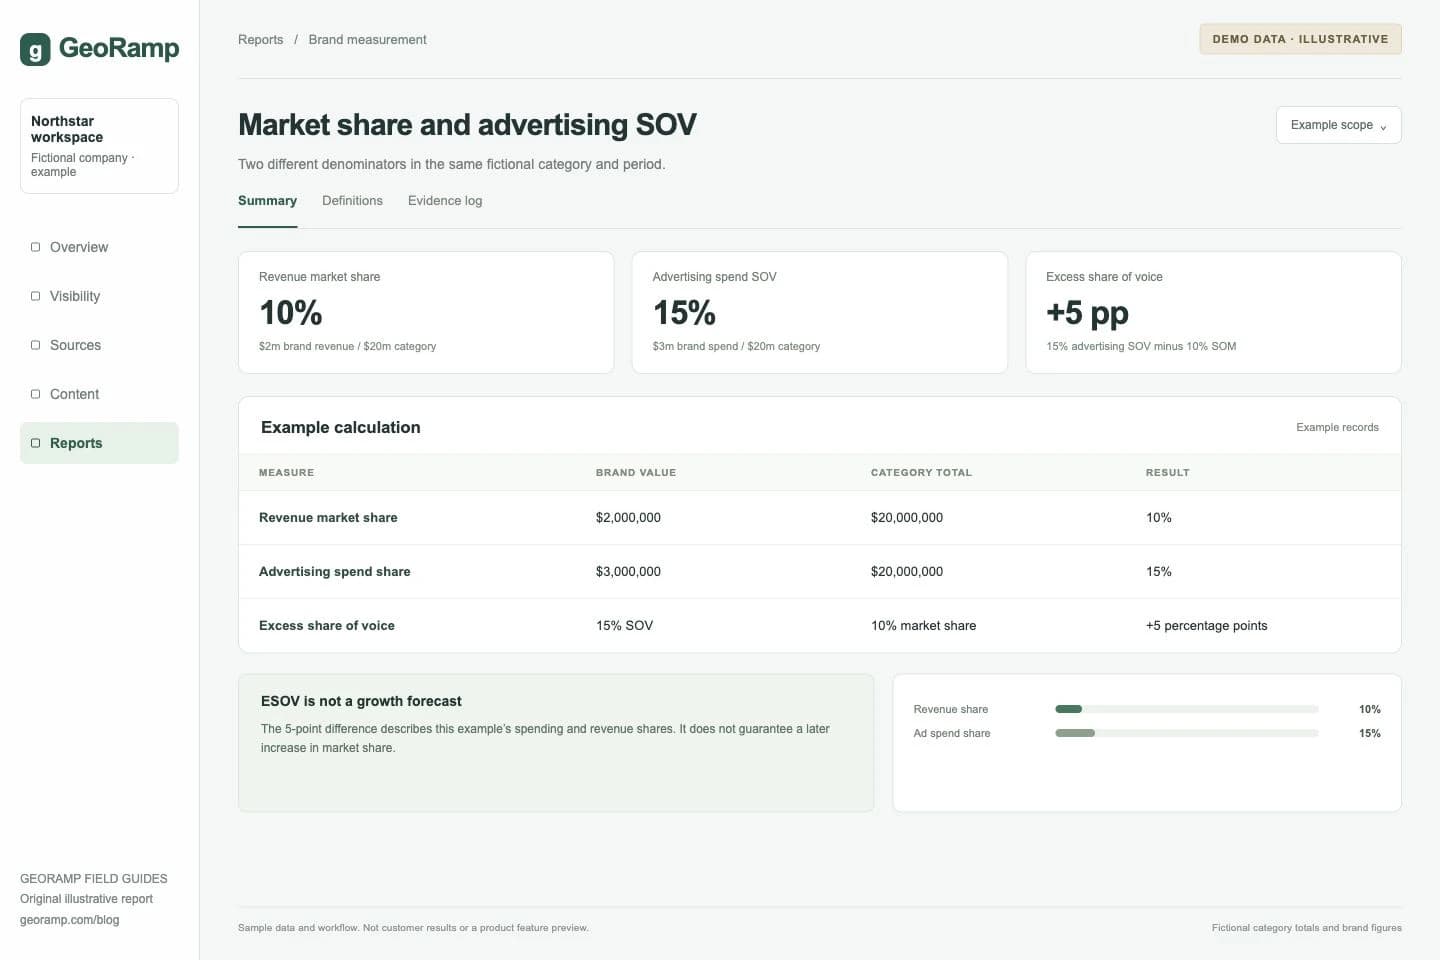
Illustrative report with fictional data and workflow examples. This is not a customer result or a preview of a specific product screen.
Using that stated advertising definition, excess share of voice is 15% minus 10%, or positive five percentage points. The calculation describes the gap. It does not say that market share will rise by five points or identify how long a change would take.
Check whether the category is really the same
A common error compares a narrow product's revenue share with the parent company's broad advertising spend. Another compares one country's sales with global media activity. Both produce precise arithmetic from mismatched inputs.
Document the category boundaries and data source for the market total. If the denominator is an estimate, show the uncertainty. Do not present a selected competitor set as the entire market unless it reasonably covers that market and the limitation is clear.
Interpret the gap with operating context
A positive gap can prompt questions about awareness, distribution, product fit, pricing, and creative effectiveness. A negative gap can prompt questions about whether strong existing demand is being maintained or whether the category definition misses relevant activity.
Neither sign determines the right budget automatically. A company may be launching, entering a new segment, or facing a capacity constraint. Those conditions change what the same number means for the next decision.
Avoid importing a universal growth coefficient from a different category or study without examining its population and method. A relationship observed in a dataset is not a guaranteed forecast for an individual SaaS company.
Keep AI visibility measures in their own context
An AI answer appearance rate divides sampled responses containing a brand by successful sampled responses. It is not advertising spend share, and competing brands' rates can overlap.
Subtracting revenue market share from that rate creates a number, but not automatically a validated ESOV measure. The same warning applies to a custom cross-channel visibility index.
Use marketing share of voice to report channel measures together while retaining their definitions. Use the paid-media SOV guide when the question concerns advertising auctions and impression share.
Put the calculation next to a decision
Show the inputs, units, scope, formula, and proposed interpretation. Then name the evidence needed before changing the plan. A transparent comparison helps a team challenge assumptions; an unsupported growth forecast makes that harder.